

Analysis of HIV/AIDS and Cholera Diseases


INTRODUCTION
In this modern age, diseases that affect us humans are well documented to help prevent future outbreaks and create practical guidelines to help deal with their spread. My team and I were tasked with creating a Health/Disease insight analysis by Side Hustle Bootcamp. To create this we worked on datasets for HIV/AIDS taken in New York and Cholera in Africa.
HIV/AIDS and Cholera continue to be major causes of both fatality and mortality worldwide. They both have significant geographical overlap globally, but little is known about the clinical features and risk of cholera among HIV-infected people and their households.
The aim of our project was to create a clear visualization of the effect of both HIV/AIDS and Cholera on the human population. This project took us through the process of data scraping, cleaning, and visualization. The tools used during the process include google, Microsoft Excel, and Power BI Desktop.
Process involved includes:
- Data Scraping
- Data Cleaning
- Data Visualization
Data Scraping: Data was sourced from both data.unicef.org and cdc.gov in CVS formats. These websites are direct links to the databank for UNICEF and CDC for Cholera and HIV/AIDS respectively. The datasets we selected majorly on our drive to adequately represent the effect of cholera and HIV/AIDS over a particular time frame.
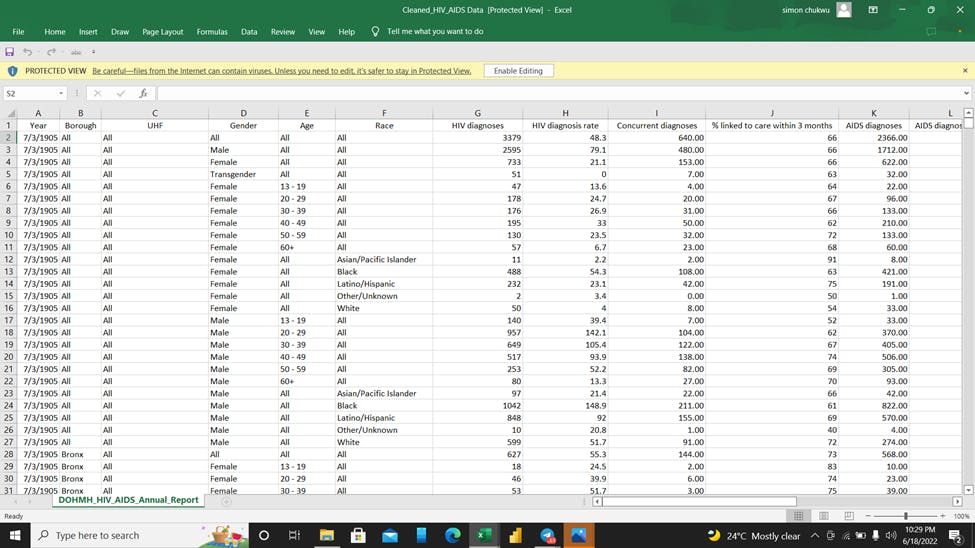
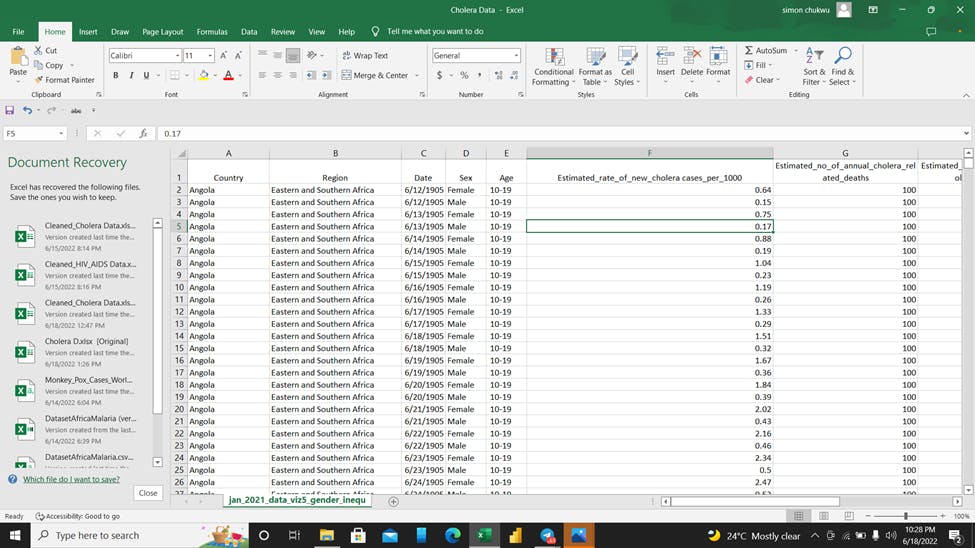
Data Cleaning: The scraped data were imported into excel to enable us to clean it using Microsoft Excel. We changed the data types for each column to better fit its description, capitalizing the first letter of each header column by using a proper function.
We also deleted a column that had 100% empty cells. We carried out a find and replace action to replace every cell in the Race column that had an entry of Other/Unknown to display an entry of Unknown, we renamed some column headers to properly describe its content. We deleted all duplicate values in the datasets. Finally proceeding to Power BI to delete all the empty columns, we also changed the data category for both countries and regions to enable us to display the affected locations on a heat map.
Data Visualization: Having transformed and loaded the datasets from Power query to Power BI, we proceeded to visualize the datasets on the dashboards. The visuals included the following:
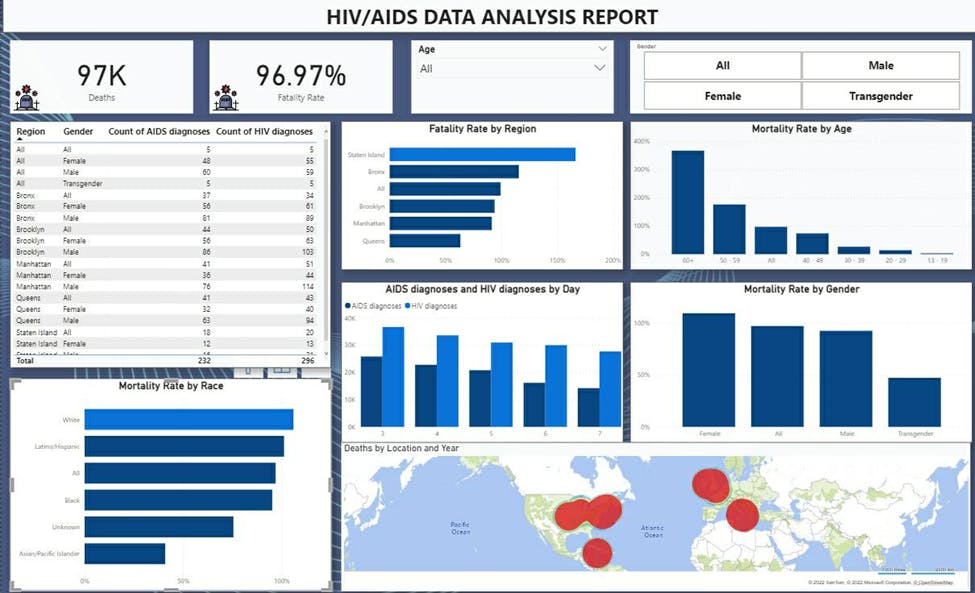
- Total Deaths
- Total mortality Rate
- Mortality Rate By Gender
- Mortality Rate By Age Range
- Mortality Rate By Region
- Infected Locations Heat Map
- Infected Demographics By Gender
- Infected Demographics by Age Range
- Reported cases by Date
FINAL RESULTS
RECOMMENDATION/CONCLUSION
Recommendation and conclusion with regards to the cholera analysis in Africa:
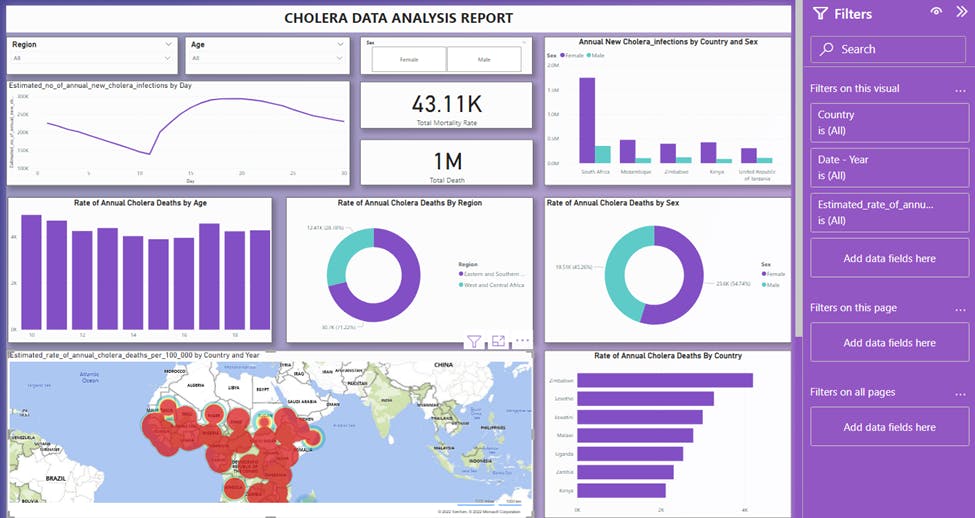
From the line graph we saw a rapid increase in cholera infection after the 11th day. This could have been a result of a lack of proper hygiene for infected patients during the beginning of the outbreak. We recommend proper sensitization of the entire population especially the rural areas, and informative talks on the importance of personal hygiene.
Generally, in the five countries listed in the bar chart showing the annual new cholera infection by country and sex, the female population in each country poses the higher rate of cholera infection with South Africa having the distinction of recording the highest rate for both men and women. We recommend that the South African Ministry of health take better care of its female population which is at a greater death risk from cholera.
From the bar chart showing the Rate of Annual Cholera Deaths by Age, we can see that the highest death rate was recorded for children of age 10. This shows that children of younger age are more prone to infection than those older. We recommend that UNICEF in collaboration with the various local health ministries should carry out adequate vaccination for children aged 10 and below.
The bar chart representing the Rate of Annual Cholera Deaths by Country shows Zimbabwe with the highest recorded death rate of above 4k. We recommend that the various ministry of health in the affected areas should carry out more awareness programs, proper vaccination, and proper and early drug administration to infected patients.
Members Contact
- ayooluwa91@outlook.com
- ezeonyililian@gmail.com
- animiraclep7662@gmail.com
- thimoh94@gmail.com
- jessicawobo17@gmail.com
- chinbenita@gmail.com
- jimamaoziada1@gmail.com
- oyewole768@gmail.com
- chukwu_simon@yahoo.com
- stephenadebiyi16@gmail.com
Sponsor