

Data Analysis on Pricing System of Laptops


INTRODUCTION
Today’s businesses consider data as a very important tool for making well-informed and data-driven decisions. However, going through a dataset to get an answer to your question can be very exhausting. This is where data visualization, an important aspect of data analytics using various visualization tools becomes essential.
Based on this understanding, my team embarked on a project under the Side Hustle Bootcamp to analyze products used by Nigerians with the aim of providing key insights via visuals, at a glance. This project took us through the process of data scraping, cleaning, transformation and visualization.
The tools used in these processes include Microsoft Excel and Microsoft Power BI.
Process Involved
Data scraping
Data cleaning
Data visualization
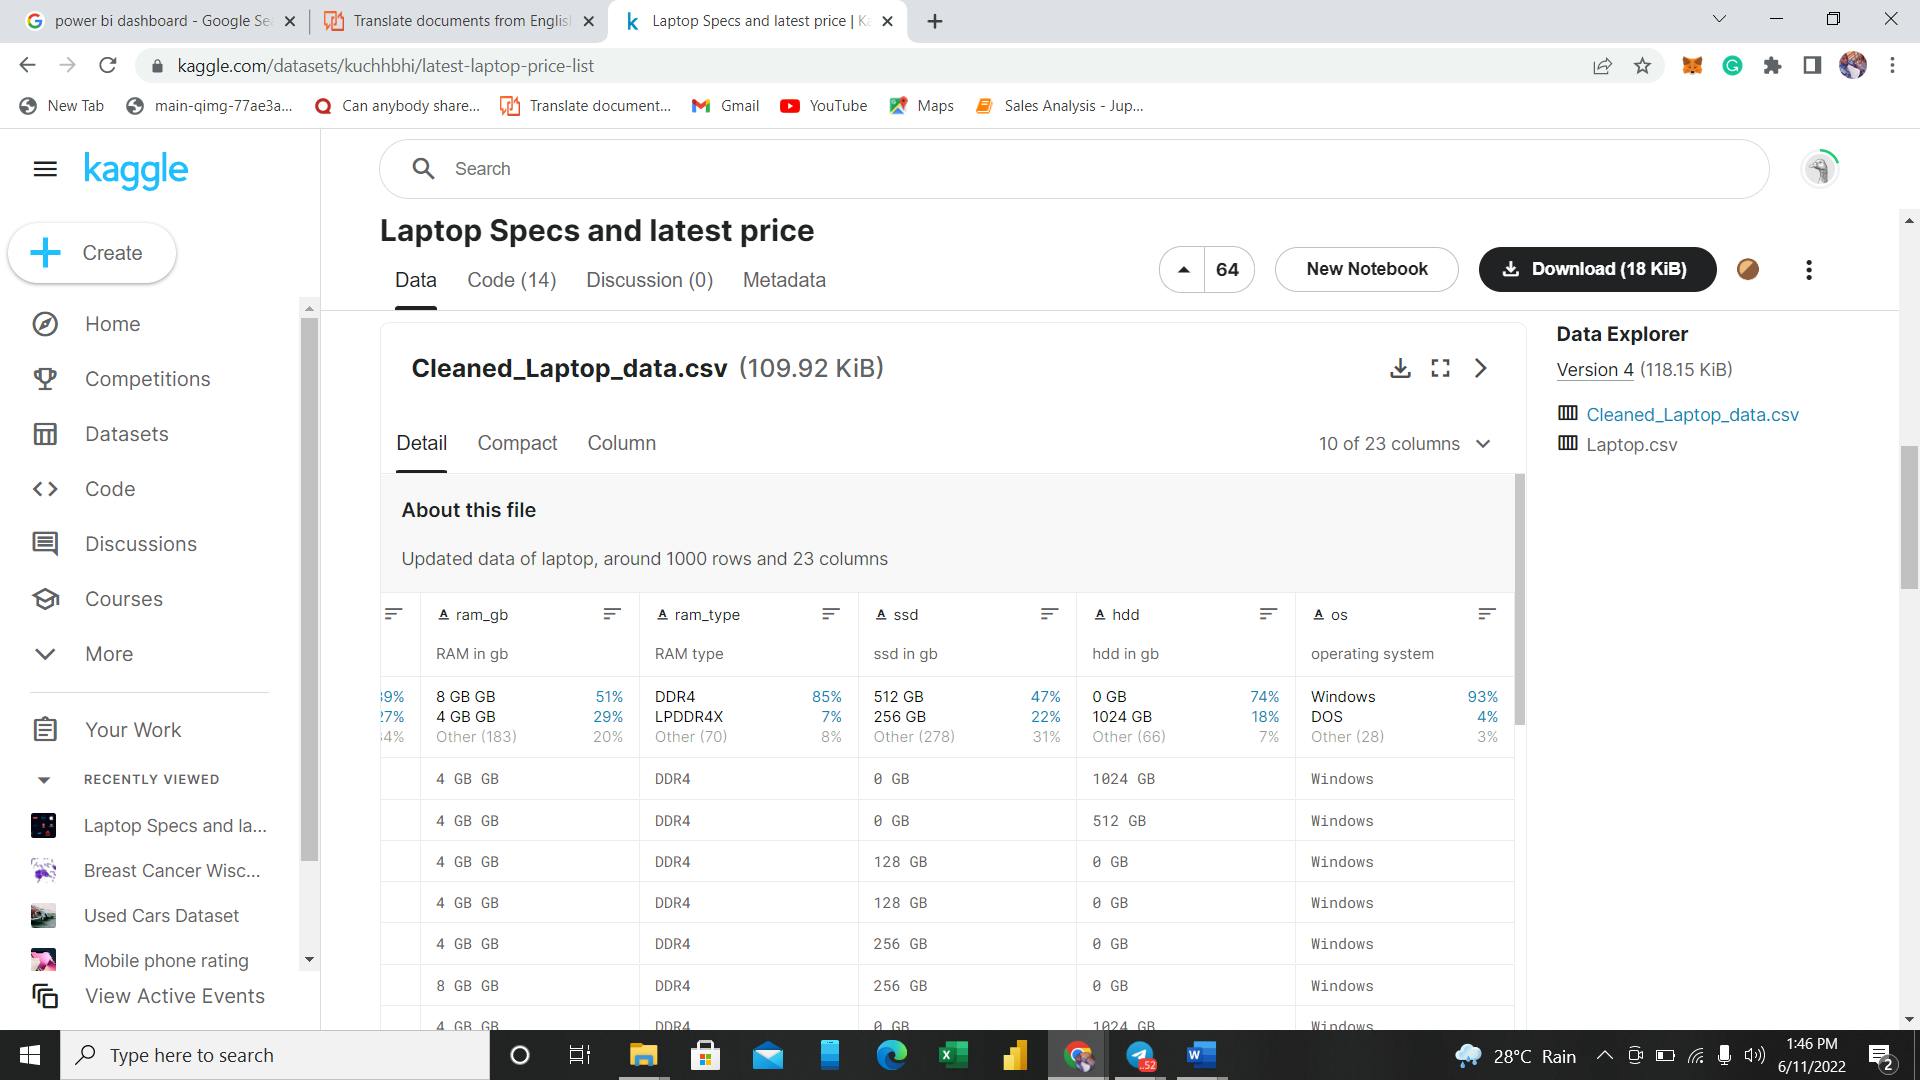
Data Scraping: Data was sourced from Kaggle.com in a CSV format and saved in excel workbook format. The CLEANED LAPTOP DATASET was selected after meeting the laid down perquisites decided by the team.
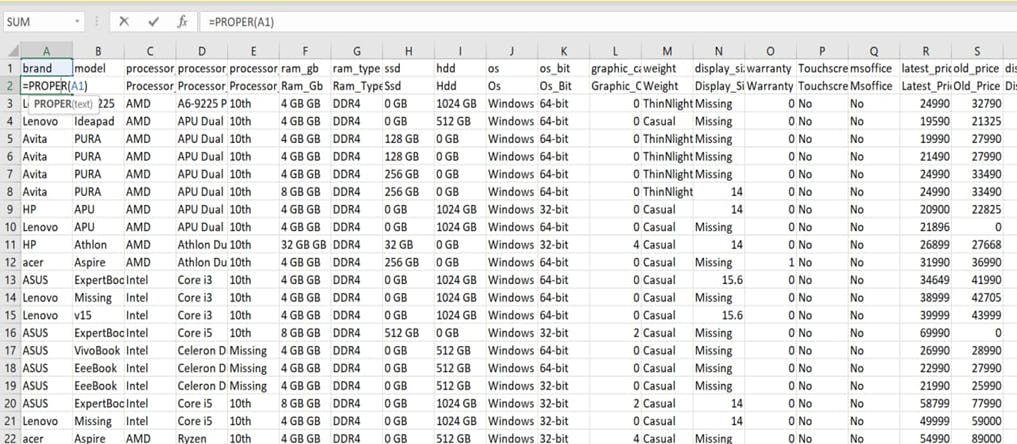
Data Cleaning: This process was carried out in Microsoft Excel. We changed the data types for each column to fit its description. We used a proper function to capitalize the first letter in each header column. We deleted columns with excessive missing values. We removed all abbreviations from the header column. We extracted values from columns using the flash fill. We used the IFERROR function to calculate the discount column in percentage. We deleted duplicate values in the dataset. We proceeded to Power Bi to merge both SSD & HDD columns to create a new column named Drive type.
Data Visualization: Having transformed and loaded the dataset from power query to Power Bi, we proceeded to visualize the dataset on the dashboard. The content of the dashboard includes:
- Cards that displayed the sum of the latest price and old price.
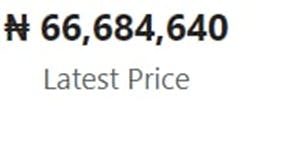

Desc. The images above show the sum of the latest price and the old price of all the laptops. This difference between the sum of prices was a result of an 8.07% discount.
- A donut chart that displayed the latest price by touchscreen.
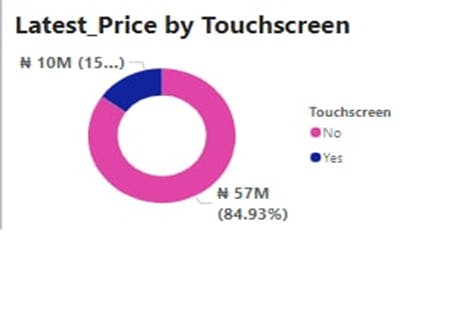
Desc. The image above shows that the total price of non-touchscreen laptops is higher than that of touchscreen laptops.
- Bar chart that displayed star ratings by brand.
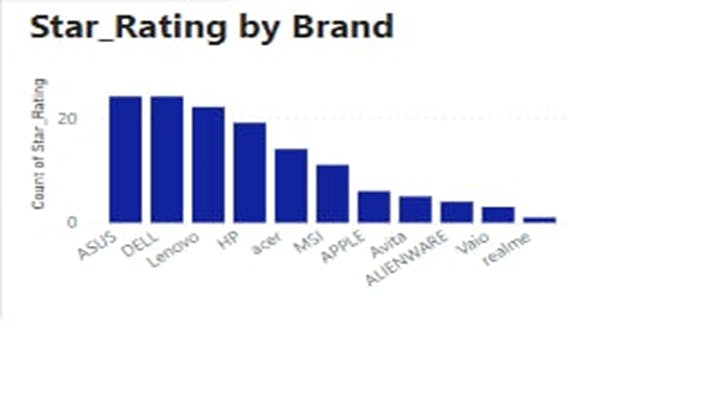
Desc. The chart above indicates that ASUS and DELL have the highest preference based on their star rating.
- Donut chart that displayed star rating by Operating System.
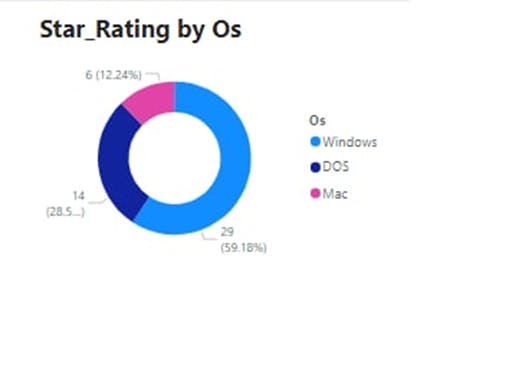
Desc. This donut chart above indicates that Windows Os has the highest preference based on its star rating.
- Bar chart that displayed star rating by touchscreen.
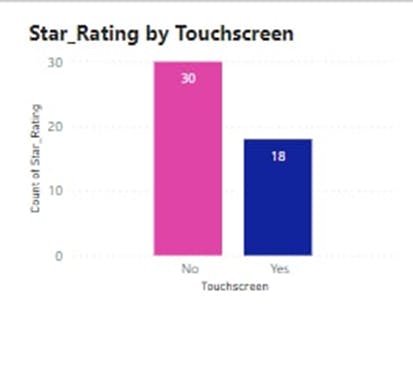
Desc. This bar chart above indicates that non-touchscreen laptops have a higher preference based on their star rating.
- Bar chart that displayed the latest price by brand.
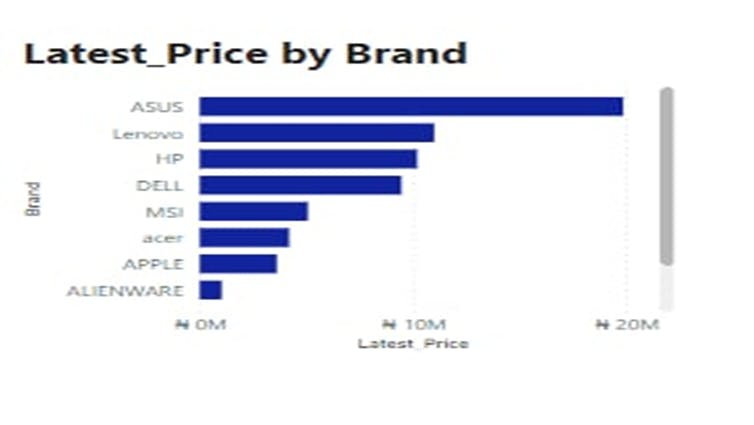
Desc. This bar chart above shows that the ASUS laptop brand has the highest latest price by brand.
- Line and cluster column chart that displayed the latest price by brand, latest price, and star rating by processor generation.
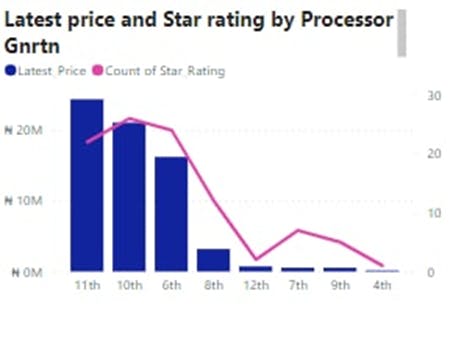
Desc. This line chart above shows the 10th generation has the highest star rating while the bar chart shows the 11th generation having the highest latest price.
- Slicers that displayed touchscreen, operating system, and ram size.

Desc. The image above shows the slicers that can be used to filter the visualization and make a comparison based on the laptop being either a touchscreen or not, the type of OS (DOS, MAC, WINDOWS), and the RAM size
Final result
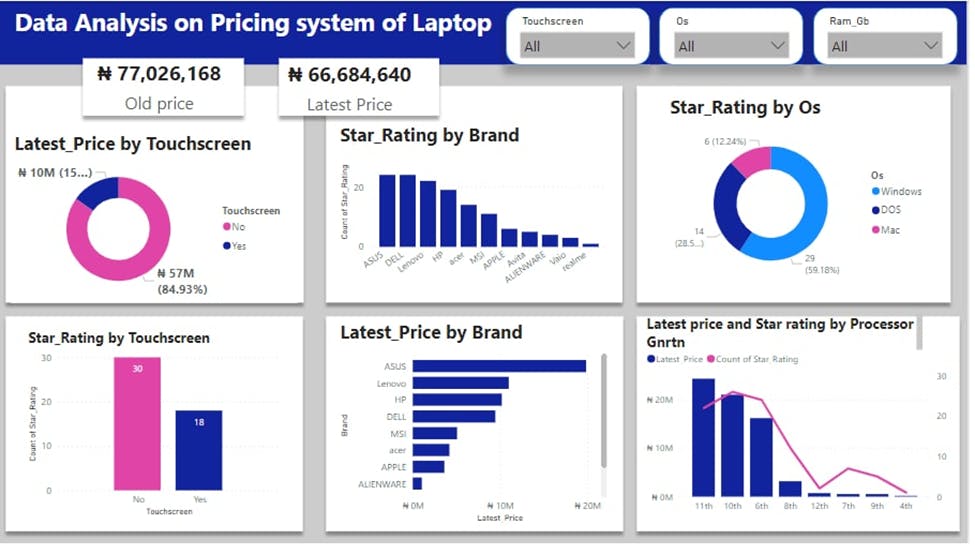
Desc. Dashboard
Recommendation / Conclusion
Regarding touchscreen and non-touchscreen laptops, there seems to be a large gap in investment between the two models, but the touchscreen laptops returned a total rating of 37.5% irrespective of how low in investment compared to the investment of non-touchscreen laptops. We hereby recommend that there should be an increase in investment in touchscreen laptops as there is a higher tendency to make more sales in the future due to their ratings.
As regards to latest price by brand, it shows that more investments were made in ASUS, LENOVO, and HP than DELL. With Dell having the highest rating among the brands alongside ASUS, there exists a higher probability of DELL brand laptops generating more revenue (more sales) than any other Brand. We hereby recommend an increase in investment in the DELL brand.
Latest Price and star rating by processor generation show that more investment was made in the 11th generation than in the 10th and 6th generations of computers, which returned a lower rating than the 10th and 6th generations. It will be ideal to increase investments in both the 10th and 6th generations which appear to have a higher tendency of generating more sales. Also, the 7th and 9th generations need to be considered due to the higher ratings recorded compared to the amount invested in them; clearly stating the fact that there is indeed a higher probability of making more sales. We hereby recommend that more investments should also be made in the 7th and 9th generations of computers.
Members Contact
Sponsor